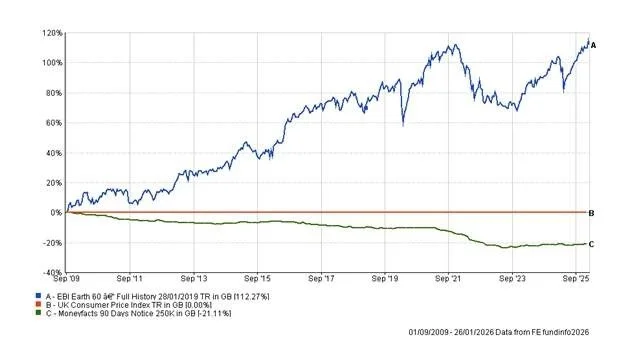
The stock market is at a record high, but it’s not a bad time to invest!

The following article appeared in yesterday’s Sunday Times, and I thought its timing was interesting, given that the market (as measured by the S&P 500 Index) is actually some 5.46% below its closing high in late March (The S&P 500 hit 5,254 on 28th March 2024 and at close of business on Friday it stood at 4,967). It’s a good article nonetheless, reminding us that just because the market is at, or close to a high, it can still go higher. In fact, I googled how often does the S&P 500 hit a new high and the answer is a staggering 17 times a year, on average or more than once in every 20 trading days. Remember though, that’s on average since the 1950s.  

Here is the article by David Brenchley of Market Watch.

“Just like death and taxes, it is a certainty in life that when the stock markets hit an all-time high, the bears come out of hibernation. Stocks are in a bubble, they will say, the market is going to crash. Bears are pessimistic investors, the opposite of bulls. They will say that now is the time to sell our investments.

When the S&P 500, a stock market index of the biggest US companies, went into freefall in 2022, plunging 27.5 per cent, sceptics thought that it would take years to recover. But already this year it has hit an all-time high on more than 20 occasions.

The naysayers have been proved wrong so far, but they continue to insist that their predictions will play out eventually. Take the bearish investor Jeremy Grantham, the founder of the fund group GMO, who has predicted 12 of the last four stock market crashes, including the dotcom bust and the financial crisis. He thinks that crash number 13 is just round the corner. Actually, Grantham thinks that we’re still only halfway through 2022’s slump, which was “rudely interrupted by the launch of ChatGPT” last year. Artificial intelligence stocks are “a bubble within a bubble”, he reckons.

For those who aren’t up on the investment lingo, a bubble is when share prices within a certain stock index or theme soar in a short space of time, often with little in the way of business fundamentals to back them up. Other stock market gurus have voiced their concern, including the former US Treasury secretary Larry Summers, who thinks we are “at the foothills of a bubble”.

And it’s hard to argue against this when the likes of Nvidia, which makes the semiconductor chips that power generative AI, is up 203 per cent in the past year, and the Facebook owner Meta Platforms has risen 132 per cent. That kind of share price growth doesn’t happen often and should ring alarm bells.

I consolidated three old workplace pensions into a self-invested personal pension (Sipp) a year ago, giving myself more control over my retirement pot. Since then I have been cautious about investing the cash because markets have risen quickly. Memories of investing a lump sum inheritance into my stocks and shares Isa in mid-2021, only to see the value of those investments slump in 2022 are fresh. So, feeling rather burnt by bad decisions/timing/investments/all of the above, this time I am doing the opposite and slowly drip-feeding money into the market.

But perhaps I shouldn’t be so cautious. Just because the stock market is at an all-time high, it doesn’t mean that it’s about to crash. It could be that I was just unlucky three years ago. The thing about an all-time high is that it is only an all-time high until it is usurped by a higher one. In fact, you tend to make more money over the next 12 months if you invest when the market is at an all-time high than you do if you invest at any other time. That’s what the fund house Schroders found, anyway.

Historically, the average return a year after the US stock market has hit an all-time high is 10.3 per cent. That compares with a return of 8.6 per cent if you invest at all other times, according to Schroders data going back to 1926. Even more than three years after an all-time high, average returns were 7.6 per cent, versus 7.5 per cent at all other times.

If you had put $100 into the market 30 years ago and stayed invested throughout, you would have $864 today. If you had invested the same amount 30 years ago but sold your holdings and moved into cash each time the market finished a month at a record high (and gone back into stocks when it wasn’t at a record high), you would have $403 today — 53 per cent less. That’s encouraging.

“It is normal to feel nervous about investing when the stock market is at an all-time high, but giving in to that feeling would have been damaging for your wealth,” said Duncan Lamont from Schroders. “There may be valid reasons for you to dislike stocks, but the market being at an all-time high should not be one of them.”

What will eventually be the core of my portfolio are funds which invest in global companies such as the Vanguard FTSE Global All Cap, Vanguard LifeStrategy 100% Equity and Dimensional International Value funds. But instead of piling cash into these holdings, I have been focusing on other areas because global stocks look expensive.

I’ve been building up my positions in funds and investment trusts that focus on UK smaller companies, emerging markets and infrastructure, as well as those that back firms with positive environmental impacts. This means that while my core investments have performed well, up about 10 per cent, it’s only a small part of my portfolio — for now.

But I have begun to regret not topping up these core funds. I had been waiting for the S&P 500 to slip, which was what the bears convinced me would happen, before I start to put more meaningful amounts into those funds.

Nvidia’s price-to-earnings (PE) ratio, a popular stock valuation metric that divides a company’s share price by its earnings per share, is 73, according to the data firm Sharepad. The lower the PE ratio, the potentially cheaper the stock, and anything over 25 is generally seen as expensive. Yet, when you judge Nvidia on the earnings it is predicted to generate in three years’ time, its PE ratio falls to a much more palatable 24. Does this mean I have been sold a duff investment theory by the bears?

The counterpoint to my cautious approach is that my workplace pension, which is held with a different firm, has been automatically investing about a third of my monthly contributions into the SSGA International Equity Index fund, which has been benefiting from the markets’ rise.

Speaking of certainties in life, here’s another one: returns from the stock market always beat inflation if you invest for 20 years or more. Between 1926 and 2022, there was no 20-year period where US large-cap stocks didn’t outperform inflation, Schroders found. The takeaway of all this is that timing the market doesn’t really matter if you’re investing over the long term, which I am because I won’t be able to get at my Sipp for at least another 21 years — and let’s face it, probably more.

I should probably get a move on, forget about past mistakes and start putting my cash to work faster than I have been. Market highs be damned”.

I hope you found this interesting and, as always, if you have any questions about this piece or any other finance-related matter, please do not hesitate to contact me.

Yours sincerely,

Graham Ponting CFP Chartered MCSI

Managing Partner


The Great British ISA

Some clients are quite surprised when they learn that over 60% of the equity content of their portfolios is invested in the US, with only a very small percentage held in the UK. This is by no means unique to the portfolios our clients hold. As you will see later, almost all pension and investment fund managers have been moving away from UK funds over many years.

The government is acutely aware of this and, with some justification, feels that this might be ‘bad for Britain’. Accordingly, in last week’s Budget, an additional ISA allowance was introduced, which only applies if one invests in the UK. There is now also a requirement for UK pension funds to disclose how much of their members' money is held in the UK. Presumably the govt. is hoping to turn things around and shift the focus back to investing in the UK – I wish them luck!

With the above in mind, I was particularly interested in the following article from Saturday’s Times by David Brenchley of Investment Eye’

“MPs aren’t betting their pensions on UK funds — and nor should you, because we all know not to put all our eggs in one basket

Sadly, MPs have very little “skin in the game” when it comes to investing. I often talk about the importance of fund managers having skin in the game — that they should invest meaningful amounts of their own, personal money into the funds that they run.

So the same should surely go for MPs. If they want to force us to invest a significant amount of our money into UK equities, they should do the same themselves.

In his budget on Wednesday the chancellor, Jeremy Hunt, created a new UK Isa. He wants to give us an extra £5,000 Isa allowance a year — on top of the usual £20,000 — but only if we use it to invest in UK-focused assets.

It feels like he is accusing ordinary, retail investors like you and me of somehow having abandoned the UK stock market and being responsible for the state of the economy.

The creation of this new Isa is rife with problems. If you invest that £5,000 into British businesses and then invest the rest of your £20,000 allowance overseas, that will mean you will have 20 per cent of your Isa portfolio invested in the UK stock market.

Most investment experts would say that having this much of your money in a single market would leave you overexposed, not least when the UK only accounts for less than 4 per cent of the global index.

Even leaving that aside, this is only OK if others do the same. Do MPs back UK shares? Do they heck. As of the end of June 2023, the Parliamentary Contributory Pension Fund (PCPF), which provides MPs with a pension for life, had £10 million of its £784.7 million of assets invested in UK equities. That means the UK accounts for just 1.3 per cent of the fund.

Where’s your skin in the game, Hunt and Sunak?

And what of the implication that ordinary investors are shunning the UK stock market? Supporters of this view will point to the net £94 billion that was taken out of UK-domiciled funds investing in UK equities since 2016 as proof.

But the reality suggests the opposite is true: we actually already have far too much invested in our home market. Retail investors are already putting half of their Isa investments into UK-focused assets every year, according to the trading platform AJ Bell.

The government might well find that those people who do take advantage of the UK Isa will simply sell £5,000 worth of UK assets from their regular stocks and shares Isa and move those investments to a UK Isa, freeing up more room to invest in global stocks.

One of the first things you are taught when you start investing is not to put too many of your eggs into one basket: you must diversify your investment portfolio.

Another key rule is to allocate your investments to the areas that you think are going to give you the best return over time. You should not choose investments out of some vague philanthropic, patriotic duty to the UK economy.

The extra Isa allowance is welcome. The £20,000 limit hasn’t changed since 2017. If it had been increased with inflation, it would be £25,000 already (though few people are in a position to save this much). That the extra cash has to be invested in UK assets is rather less welcome (not least because we don’t know exactly which ones will be eligible yet).

If Hunt and the British Isa’s cheerleaders in the City expect it to magically increase UK companies’ share prices or to encourage more companies to list on the London Stock Exchange, they will be disappointed. A British Isa will have absolutely no impact on the UK stock market. I don’t know how they can’t see that.

Considering that the £20,000 allowance is already more than half of the average annual salary, I, and most people my age, have no need for an extra £5,000 allowance.

The only savers that will open one will be those that regularly max out their £20,000 allowance. That was 1.6 million people in the 2020 to 2021 tax year, according to HM Revenue & Customs. But half of those were savers who maxed out their cash Isa — not investors. Only 802,000 maxed out their stocks and shares Isa allowance.

The boost that the UK stock market would get if all of those 802,000 people invested £5,000 into UK companies would add up to £4 billion. It sounds like a lot of money, but it accounts for only about 0.2 per cent of the combined worth of all companies listed on the FTSE all-share index. That’s a drop in the ocean.

And that’s assuming that all those who max out their Isas every year actually want to invest in UK stocks. AJ Bell surveyed 1,852 of its customers and found that only 14 per cent thought that the UK Isa was a good idea.

I won’t mince my words: it’s a terrible idea. And until MPs are forced to use their own pension fund to invest significantly more into UK stocks, they can’t really start lecturing you and me about how we’re not backing Britain.”

David Brenchley

I am inclined to agree with most of what David says; the most important sentence being, “You should not choose investments out of some vague philanthropic, patriotic duty to the UK economy.” There is a reason why fund managers are eschewing the UK market in favour of the US and it is because almost all technology companies are listed there. The UK market is largely made up of what I would describe as ‘old world’ companies, miners, oil companies and banks etc. and I think most would agree that there appear to be greater prospects for growth from the new tech businesses in the US, AI for example. Even our own ARM Holdings (a computer chip manufacturer) faced with the choice of listing in the UK or the US, chose the US; I would imagine this decision was a ‘no-brainer’ for the board. 

I hope you found this interesting and, as always, if you have any questions about this piece or any other finance-related matter, please do not hesitate to contact me.

Yours sincerely,

Graham Ponting CFP Chartered MCSI

Managing Partner


It’s That Time of the Year Again!

As we approach the end of the 2023/24 tax year, thoughts inevitably turn to end-of-year tax planning and any unused allowances (ISA, Pensions, etc.) that may be available.

The ISA allowance for 2023/24 is £20,000, and if you have not made a subscription (or perhaps you have only made a partial subscription), there is still time to use this allowance if you have the funds available.

Since 6th April 2016, in addition to the subscription, it has been possible to top-up ISAs with any amounts withdrawn during the tax year, including any charges deducted. This means that even if you have not made a subscription this year but have ISAs from previous years, your personal ISA Allowance may be more than £20,000 because of charges deducted during the year. If you made a subscription at the beginning of the tax year, you may still have a residual allowance left because of these deductions, which can be utilised by 5th April 2024.

If you have a Standard Life Wrap Account, the scope for top-up (in addition to any unused subscription) does not apply unless you take physical withdrawals from your ISA. This is because Standard Life deducts ISA charges from the cash held in your Portfolio, not the ISA itself.

If you have a Transact Wrap Account and want to know your personal ISA allowance for the remainder of the 2023/24 tax year, you can access this information on the Transact website. From your home page, select reports, and from the drop-down menu, select ISA Subscriptions.

If you would like to use the balance of your allowance before 5th April, please ensure you advise us of your intentions before the end of March; we will be very pleased to assist.

Just for information, the ISA Allowance for 2024/25 is likely to remain £20,000 each, so £40,000 per couple. However, there is a Budget on 6th March, so this could change.

Capital Gains Tax (CGT)   

Currently, rates for CGT are 10% for Basic Rate Taxpayers and 20% for Higher Rate Taxpayers; where property assets are concerned (excluding the main residence), the rates are 18% and 28%, respectively. There is an allowance each year (currently) of £6,000 before CGT becomes payable. You may recall that in Jeremy Hunt’s emergency Budget when he took over as Chancellor, he announced that CGT allowances would be reduced further to just £3,000 in 2024/25.

Income tax rates, of course, are 20%,40%, and 45%, so they are quite a bit higher than taxes on capital gains!

It might be sensible to consider using this year’s CGT allowance before the end of the tax year. If you wish to look into this, please let us know, and we will try to assist.

If you have a General Investment Account (GIA) with us worth more than £250k, we will contact you individually over the next couple of weeks or so.   

Many of our clients will not need to take any action, as most assets are held within ISAs and Pensions, where CGT does not apply.

As always, if you have any questions about this piece or any other finance-related matter, please do not hesitate to get in touch.

Yours sincerely

Graham Ponting CFP Chartered MCSI

Managing Partner


Introducing Financial Passport

We are pleased to introduce our new Financial Passport, which has been designed to enable you to keep your essential financial information in one place. We took inspiration from the Age UK Lifebook in its design.

Recently, I encountered a situation where an unexpected death left loved ones without clear records of financial arrangements or final wishes. This challenging scenario forced them to navigate the complexities of settling someone’s affairs amidst profound grief. Their task would have been made immeasurably easier with the existence of a completed Financial Passport.

Amidst life's myriad details, keeping track can feel overwhelming. Your Financial Passport offers a solution, ensuring that everything you need is conveniently located when it matters most.

This passport allows you to centralise vital information in one accessible place—an investment your future self will undoubtedly appreciate. Whether retrieving details about a beloved pet or contacting an energy supplier, you will effortlessly locate the necessary information.

The benefits extend beyond personal convenience. Sharing details of your Financial Passport with trusted family and friends may significantly simplify their lives in the future. In the event that someone needs to manage affairs on your behalf, having all necessary information in one place will make a difficult task much less stressful.

Take a moment to complete your Financial Passport. Share it with someone you trust. Keep it secure and update it frequently. Experience the peace of mind that comes with knowing your financial details are well-organised and easily accessible when needed.

The following link will take you to the location of Financial Passport on our website, where you will find three possible versions for you to download and complete, depending on your preference:

https://www.clearwaterwealth.co.uk/useful-docs

It’s important when filling out your Passport not to include any sensitive information such as bank account numbers, PINs or key security information. You should make sure this information stays confidential and isn’t recorded where others could find it.

We will be quite happy to retain a copy of your Financial Passport if you would like us to do so. Once completed please feel free to upload it using our secure portal by following this link:

https://www.clearwaterwealth.co.uk/file-share

If you have any questions about Financial Passport, please do not hesitate to get in touch, we would welcome your feedback in any event.

With very best wishes,

Yours sincerely,

Graham Ponting CFP Chartered MCSI

Managing Partner


Bears and Bulls

Why are rising markets called bull markets and falling markets called bear markets? As with most things in finance, there are lots of different explanations.

The most common one I’ve heard is that bulls attack by throwing their head upwards, whereas bears swipe the claws downwards.” Happy to take that on trust, to be honest! Other explanations include the 18th-century bearskin trade or the Elizabethan tradition of bulls fighting bears in the arena.

At the end of last week, the S&P 500 finally climbed back above its previous all-time high, it’s taken about two years. We haven’t seen such a protracted bear market period since the financial crisis of 2007-09 and before that, the bursting of the dot-com bubble at the end of 1999-2003, so it’s been quite painful for investors who haven’t seen much (if any) growth in that time. Inevitably, the impatient start to question whether this time it’s different and whether markets will ever go up again – but of course, eventually, they do.

Source: Factset/7IM

I have often said that all-time highs aren’t important – equity markets go up over time, so all-time highs are completely normal. Ignore it; move on. But! While in general, all-time highs don’t matter, getting back to an all-time high defines the transition between bull and bear markets.

Here’s how it’s worked out:

  • Once an index falls 20% from its high, it’s in a bear market.

  • You only count a bear market over once the previous high is reached (last Friday) ….

  • … and then it’s easy to identify where the low point was – and you count the new bull market as starting from that day (12th October 2022) …

So, I can now exclusively reveal that the 2022 S&P 500 bear market lasted just over 9 months – and the peak to trough was -25%.

Let’s put those numbers in historical context – using one of my (many) favourite charts, although I am sorry it’s a little blurry!

Source: 7IM, Bloomberg Finance L.P. , Past performance is not a guide to future returns, chart(s)/data for illustration purposes. Returns and analysis is based on daily price returns. The chart is for illustrative purposes only.

So, the 2022 bear was about average in length and slightly better in terms of the pain suffered. More teddy than grizzly.

Turns out bear markets are – as the chart is meant to show – very, very survivable!

As I have said many times, we must be fully invested to benefit from the green upsides on the chart and suffering the orange downsides is but a small price to pay. As the chart shows, the upsides MASSIVELY outweigh the downsides.

I hope you have found this interesting, but if you have any questions about this piece or any other finance-related matter, please do not hesitate to get in touch.

With very best wishes,


Yours sincerely

Graham Ponting CFP Chartered MCSI

Managing Partner


Happy New Year!

A very Happy New Year to you all, I do hope you had a lovely Christmas with your families and for those of you who I know have had a very tough time recently, I hope you were able to get through the festive period as well as could be expected.

I am indebted to my friends at 7IM for the data in the following piece.

The calendar year – a counting system formed roughly two millennia ago* – still governs much of what we think and do.

Take, for example, New Year’s Resolutions; many of them will be about getting fitter or healthier.

And so, at the start of every year, there’s a regular phenomenon. Online searches for health-related terms SPIKE (as you can see in the Google Trends chart below). You can also see the impact of COVID lockdowns in 2020 and 2021 – “gym” searches fell, but “exercise” searches shot up

Source: Google Trends, searches for “gym” and “exercise” in the UK. Grey vertical lines show January.

It’s tempting to think that the calendar will be just as important for financial markets. So there are all sorts of “calendar effects” which people get very excited about. The Santa Rally. Selling in May.

"The January Effect" is the term used to describe a phenomenon in the stock market where there is a tendency for stock prices to increase during the month of January. It is believed to be caused by various factors, including year-end tax selling, investor optimism for the new year, and fund managers buying stocks at the beginning of the year.

So, have we found it? A fool-proof way to beat the market! Wait until the end of January, and then only invest if the market is positive?!

Sadly (and as you probably expected), NO.

The effect isn’t even that common. In the UK FTSE 100, the January Effect has occurred 17 times in the last 30 years (the bars with a black outline on the chart below). That’s only just over half the time. Might as well toss a coin!

Source: Factset. Blue bars show the total return in January, and Pink bars show the total return over the whole year.

And in terms of generating a good investment return, there are (at least) two problems with the strategy.

  •  First, you miss some great years because of a bad January. In 2021, for example, the FTSE 100 lost 1% in January, but then was up 18% over twelve months. 1995, 2003, 2009, 2010, 2016, and 2017 were similar.

  •  Second, even if you DO invest, you miss out on January’s return, because you’re waiting to see what happens! So even on years where you’re right, you only get 11 months of return! In 2023, the FTSE 100 rose 8% over the year. But 4% of that was in January – so waiting meant you missed out on half the return!

It’s no wonder then, that if you’d have followed this plan (only invest in the FTSE 100 if January is good), you’d have made 281% over the last 30 years, compared to the 660% you’d have made if you’d just stayed invested for the whole time!

When it comes to investing, the only purpose of a calendar is to track the number of years you've been invested. This is what really matters!

I do hope 2024 brings you all you would wish for and, as I stated in my Christmas e-mail, please remember, every minute of life is precious and will never be repeated, so take time to enjoy, be grateful for, and celebrate your existence!

With very best wishes,


Yours sincerely,

Graham Ponting CFP Chartered MCSI

Managing Partner


Festive Greetings!!!

Adam, Kim, and I would like to take this opportunity to thank you for your continued support and of course to wish you and your family a very Merry Christmas and a Happy New Year!

As with quite a number of years now, in lieu of sending individual Christmas cards, we have once again decided to make a donation to a worthy cause.

I recently received the sad news that a friend of mine had passed away and that in the years preceding his death he had been struggling with mental health and alcohol issues – I had no idea! In our last conversation earlier this year, he was seemingly as bright and upbeat as ever, there were no clues to the turmoil he must have been going through behind closed doors.

This has caused me to reflect that there must be many people who we interact with daily, maybe even close family and friends, who are dealing with issues privately of which we know nothing. It has reminded me to be less judgemental when someone might be behaving a little strangely and above all, to be kind.

Instinctively when we become aware of a situation such as my friend’s passing, we ask, ‘Could I have said or done anything that might have made a difference, if only I had known?’ It’s a sad fact however, that we often don’t know about peoples’ mental health issues because there is still a stigma attached to discussing such things, people are therefore left to struggle alone.

Fortunately, there are charities such as Mind who can provide valuable assistance. If we can work towards removing the stigma around mental health and encourage those who need it to seek help, we would all be making a positive difference.

Our chosen charity this year is Mind; you can find more information about the important work they do here Home - Mind.  

I do hope 2024 brings you all you would wish for and please remember, every minute of life is priceless and will never be repeated, so take time to enjoy, be grateful for and celebrate your existence!

With very best Christmas wishes,

Yours sincerely,

Graham Ponting CFP Chartered MCSI

Managing Partner


What a difference a month makes!

This communication is a follow up from a couple of earlier circular e-mails which looked at market timing and managing investor behaviour.

As I hope most of you have noticed, when markets are seemingly in freefall, I like to send out more circulars than usual, reminding everyone not to panic because market gyrations, even quite violent ones, are part and parcel of long-term investing, we just need to be patient and let them pass, which they surely will in time. I also regularly revisit the issue of ‘market timing’; buying at the bottom and selling at the top sounds ridiculously easy, particularly when we are looking at a chart of recent market movements (20:20 hindsight and all that), but in practice, as many decades of evidence proves, it’s almost impossible to pull off, regularly and consistently, such that you have a better experience than other investors.

If markets always recover (eventually), it follows that there must be some good news from time to time. I am going to use a few charts below to emphasis this point.

This first chart looks at the performance of 3 of the ebi portfolios since 31st December 2021 up until 27th October 2023, which is around the time I was last reminding everyone not to panic.

As we can see, it turns out that December 2021 was the last high point for markets, almost 2 years ago. We know why of course, markets have fallen subsequently due to roaring inflation leading to aggressive interest rate rises, the invasion of Ukraine and the subsequent energy crisis etc.

An interesting feature of this chart is how, the highest risk portfolio (Earth Equity), the lowest risk portfolio (Earth Bond) and the most popular portfolio (Earth 60), had reached virtually the same place by 27th October, even though under normal market conditions they are supposed to behave very differently. Again, we know why; higher interest rates mean less money in peoples’ pockets, which is bad news for companies and their borrowing costs also increase leaving less money for investment – the result under these conditions is that shares fall. Higher interest rates are also bad news for bonds because the fixed income they provide becomes less attractive – the result is that bonds fall in value at the same time as shares. The proverbial perfect storm.

BUT, what has happened since 27th October? Let’s take a look.

The prospect that interest rates may have peaked in the face of falling inflation and may soon even start to come down has given the markets a significant boost, the Earth Equity portfolio is up close to 6% in less than a month, even though interest rates have not actually moved an inch…yet! This recovery of sorts adds weight to my earlier e-mail where I talked about how missing the best days that come along in a year can have a serious impact on overall performance. On the subject of market timing, who honestly would have disinvested on 31st December 2021 to miss the down swing and then have reinvested on 27th October to fully capture the upswing?  Missing the precise date to come out and the precise date to go back in would have made a huge difference and the chances of anyone getting it right in the absence of blind luck, are probably about the same as winning the lottery.

It is important to point out, if you didn’t already know, that this recovery through November has not taken us back to where we were on 31st December 2021, so let’s take a look at a couple of longer-term charts to put this all into perspective.

In this chart, which begins on 31st December 2019, we can clearly see the sharp decline caused by COVID and the equally sharp rise as we recovered from it. As is typical of markets, the decline was probably overdone, as was the recovery; if we were to draw a straight line from the bottom of the COVID inspired trough to where we are now, a recovery of that shape would probably have made more sense, given the recent economic backdrop.

This final chart looks at how 2 major fund managers (7IM and St James’ Place) have fared over the same period, against the similarly weighted ebi Vantage Earth Portfolio 70.

The purpose of this last chart is just to demonstrate that market conditions have been difficult for all fund managers, although it does look as though SJP have had a good run this year.    

I hope you have found this interesting but, if you have any questions about this piece or any other finance related matter, please do not hesitate to get in touch.

Yours sincerely,

Graham Ponting CFP Chartered MCSI

Managing Partner


A little more on the subject of Artificial Intelligence

This is a follow up from a note I sent last month on an AI program’s attempts at trading stocks. I am indebted to my friends at 7IM for much of what follows.

The finance world can seem like it’s dominated by technology – and in many ways it is, what with high frequency trading, crypto-currencies, and of course, now, AI.

But when people start worrying about the lack of need for human intervention, it’s helpful to remember that markets will ALWAYS be weird enough to need people.

Finance is FULL of weirdness … because humans are full of weirdness – biases, habits, emotions etc. Plugging all of this weirdness into an algorithm is almost impossible to do. Because mostly, it’s psychology at work. Here’s some of the weirder things a computer might miss:

No onions please

You can buy and sell a lot of commodities using futures in the United States. These are financial contracts which ultimately result in the delivery of a real-world product.

If you buy a corn or live cattle future, you need to have a big old barn ready for when your grain or cows arrive.

Or if you sell a nickel or wood pulp future, you’re going to need to have a lot of metal or trees in your back garden to meet your contract.

But – and this would be hard for a machine to figure out – you can’t, ever, buy or sell a future on onions.

Because in 1955, a farmer called Vincent W Kosuga used the onion futures market to buy more than 98% of the available onions in Chicago, making millions of dollars, and driving other onion farmers out of business. The public backlash was so extreme that President Eisenhower banned any trading in onions futures – and the law still stands today.

(There’s a great free podcast here https://www.npr.org/sections/money/2015/10/14/448718171/episode-657-the-tale-of-the-onion-king).

Touch the seat to trade

Or, try explaining to a computer why it has to be touching the red sofa in order to make a trade on the London Metal Exchange (below). And then try to find an algorithm with a leg!

Source: London Metal Exchange

Unknown currency conventions

Or, try to explain how the convention of currency quoting works on global markets – do you say “pounds per US dollar” or “US dollars per pound”. Important to make sure everyone’s saying the same thing on a market that trades $7.5 trillion a DAY!

The good news is that there IS a hierarchy of which currency is the “base” (i.e. the Y, in X per Y) - :

1. EUR
2. GBP
3. AUD
4. NZD
5. USD
6. CAD
7. CHF
8. JPY

You’ll note that the US Dollar (by far the most important global currency) comes 5th. Is there an explanation for that? Absolutely not – there are no rules written down, it’s just passed from one currency trader to another when they start trading!

When it comes to capturing the human element of markets (or life), there’s likely to be a few stumbling blocks, even for the smartest computer …

However, it never pays to become too complacent, I remember a time when the idea of driverless cars and trains was unthinkable!

I hope you have found this interesting but, if you have any questions about this piece or any other finance related matter, please do not hesitate to get in touch.

Yours sincerely,

Graham Ponting CFP Chartered MCSI

Managing Partner


A Question of Costs

Many of you will have seen the article in the Money section of the Sunday Times at the weekend, celebrating a victory for the newspaper in their campaign against high charges levelled by St. James’ Place (SJP), one of the largest financial advisers in the UK. SJP are not independent of course but according to the Sunday Times, they currently manage £158 billion on behalf 941,000 customers.

Following a new initiative by the Financial Conduct Authority (FCA) called Consumer Duty, SJP have finally agreed to remove the 6% charge they levy on early withdrawals of pension investments. Independent Financial Advisers (IFA) like me, have been frustrated by how they have been able to get away with this for so long. Since 2017 pension exit charges have been capped at 1% by law (Clearwater charges 0%), but SJP had managed to justify its 6% charge by saying it is not an exit penalty but an “early withdrawal charge”. Talk about semantics.

Good news then for SJP customers! Not so fast! SJP will not introduce these changes until the second half of 2025 (why wait?), and the exit charge will be replaced with an initial advice charge of 4.5% (Clearwater charges a maximum of 1%).

It’s not all about cost of course, there is the question of value; as my late father said on this subject, “You wouldn’t buy a cheap parachute, would you?” If additional costs lead to superior performance, what’s the problem? BUT according to BestInvest in August 2023, SJP was rated the worst performing fund manager overall, managing six of the ten worst ‘dog funds’ with £29.3bn among them, and topping the 'Great Dane' list of the largest laggards. SJP ran more than 63% of the underperforming assets in the whole sample, far more than second-placed Artemis with 5.8%.  

Despite appearances, the purpose of this missive is not simply to have a go at SJP, but reading the Sunday Times article got me thinking about how difficult it is for consumers to understand the costs of financial advice and for them to know how competitive (or otherwise) their financial adviser really is! Understandably, fees and value always come under the spotlight when investments are performing poorly, even though most clients understand that Financial Advisers and fund managers cannot influence markets, whether they are rising, falling, or moving sideways.  

I will now try and illustrate where Clearwater fit into the cost/value picture. The following is taken from some research by Numis, a market analyst, that was published in the Financial Times recently. Adam has added Clearwater to the table for comparison purposes.

The above figures include, advice costs, platform costs, investment management costs and an allowance for trading costs i.e., the total cost of running a portfolio using a Financial Adviser. Even direct offerings can be more expensive than some Financial Advisers, Numis said that DIY platform Hargreaves Lansdown customers paid about 2.28% a year on average over a ten-year period.

Let’s come back to the question of value. Just where do Financial Advisers like Clearwater add value, particularly when one’s investments are going down and your adviser, on the face of it, appears to be doing very little?

Source: Brad Jung Russell Investments

The interesting thing about the above graphic is that it is blocking clients’ bad behaviour that adds most value i.e., advising clients not to sell after a market fall or not to look for short-term gains when markets have hit a new peak.

There is a way of measuring this effect: see graphic below of the 30-year Dalbar study in the US.

Source: Dalbar

The conclusion drawn from the above is that without an adviser to hold their hand, the average investor will underperform the market in which he/she is investing, and this begs the obvious question, why does this happen?

The answer is neatly conveyed in the following picture:

The answer is clearly behaviour! If we as advisers can prevent our clients falling into the Behaviour Gap, we are truly adding value over the long-term, even though it might not be immediately obvious in the short-term.

The above just looks at the impact of advice on investment returns and I would argue this is just a small part of what we do. Once we have accepted that capitalism works and that over the longer term a highly diversified portfolio will deliver inflation beating returns, we can begin to focus on the really important aspects of Financial Planning that are sometimes a little less tangible. We can help answer profound questions such as, what do I want to do with the rest of my life and how can I achieve that? When can I stop doing the things I hate and start doing the things I really enjoy? Can I afford to help my children and if so, with how much? Can I afford to turn left when I get on the plane, once in a while? When can I achieve peace of mind?

I see the most important part of my role as helping my clients to enjoy their best lives, within the constraints of the resources at their disposal, and the best way to do this is with a long-term focus and not making knee jerk reactions when things seem temporarily off track.

A useful thing to remember when markets are falling is the following:

“All equity market declines are temporary and eventually give way to the resumption of the permanent advance. Permanent loss in a well-diversified portfolio is always a human achievement of which the market itself is incapable” – Nick Murray

Nick Murray is eluding to the fact that losses only become permanent if you sell!

I hope you have found this piece interesting but, if you have any questions about this piece or any other finance related matter, please do not hesitate to get in touch.

Yours sincerely,

Graham Ponting CFP Chartered MCSI

Managing Partner