The Cost of Timing the Market

Timing the market: Why it’s so hard in one chart.

Timing the market seems simple enough: buy when prices are low and sell when they’re high.

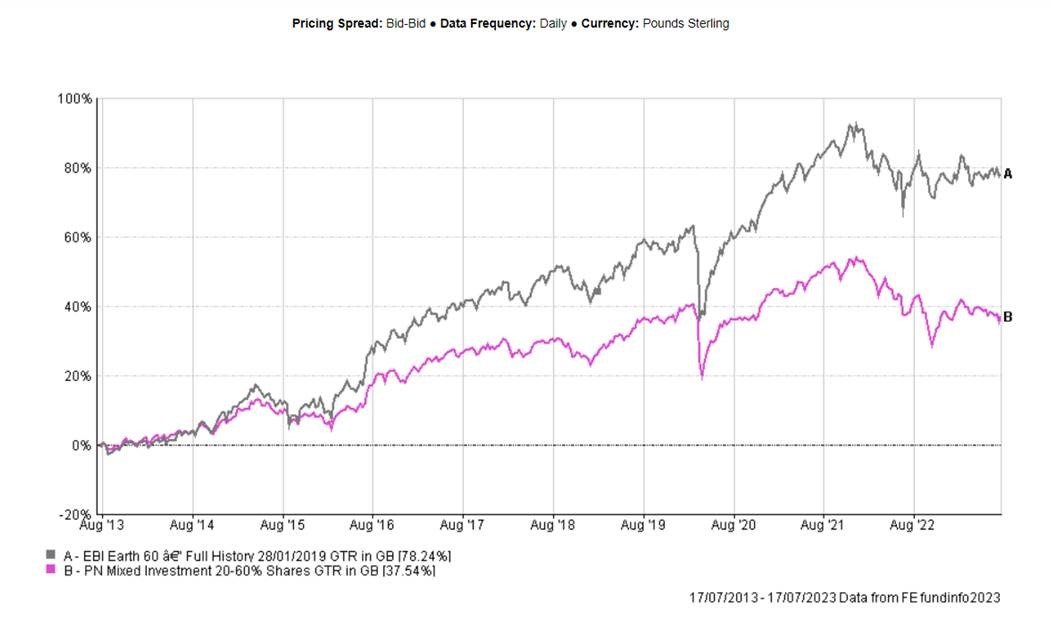
But there is clear evidence that market timing is difficult. Often, investors will sell early, missing out on a stock market rally. It can also be unnerving to invest when the market is flashing red. This is indeed a major part of the problem; market timing involves making not just one very tricky decision but two; when do I come out of the market? And when do I go back in? If an investor comes out of the market and the market falls further, he/she can congratulate themselves on their timing BUT unless he/she goes back into the market still at a price lower than when they came out, the exercise will have been counterproductive. I often hear people say, ‘I’ll wait for the market to settle down before I invest’, but it is this ‘settling down’ that is usually the market recovering and as the chart shows, you really don’t want to miss that.  

By contrast, staying invested through highs and lows has generated attractive returns, especially over longer periods.

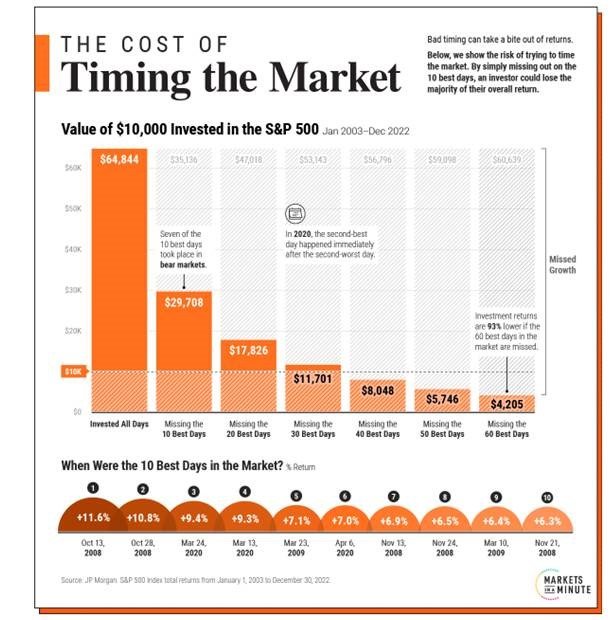
The above graphic shows how trying to time the market can take a bite out of your portfolio value, using 20 years of data from JP Morgan.

The Pitfalls of Timing the Market

Mistiming the market even by just a few days can significantly affect an investor’s returns.

The following scenarios compare the total returns of a $10,000 investment in the S&P 500 between January 1, 2003 and December 30, 2022. Specifically, it highlights the impact of missing the best days in the market compared to sticking to a long-term investment plan.

As we can see in the above table, the original investment grew over sixfold if an investor was fully invested for all days.

If an investor were to simply miss the 10 best days in the market, they would have shed over 50% of their end portfolio value. The investor would finish with a portfolio of only $29,708, compared to $64,844 if they had just stayed put.

Making matters worse, by missing 60 of the best days, they would have lost a striking 93% in value compared to what the portfolio would be worth if they had simply stayed invested.

Overall, an investor would have seen almost 10% in average annual returns using a buy-and-hold strategy. Average annual returns entered negative territory once they missed the 40 best days over the time frame.

The Best Days in the Market

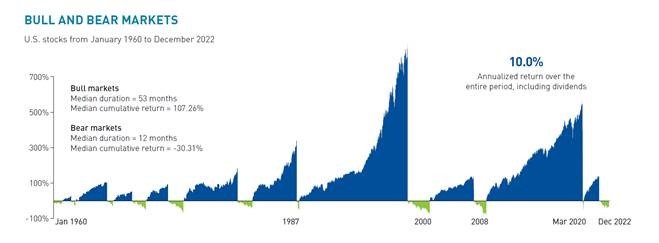
Why is timing the market so hard? Often, the best days take place during bear markets.

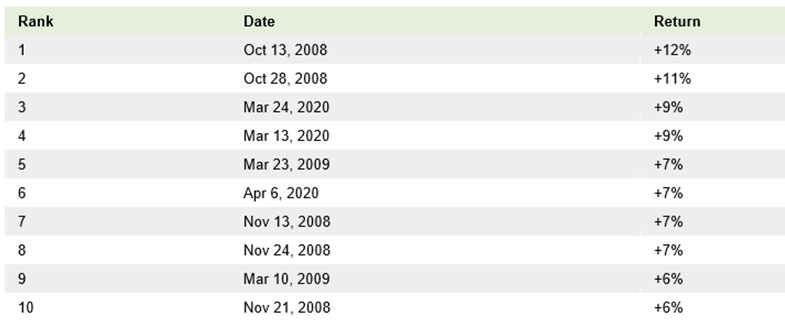
Over the last 20 years, seven of the 10 best days happened when the market was in bear market territory.

Adding to this, many of the best days take place shortly after the worst days. In 2020, the second-best day fell right after the second-worst day that year. Similarly, in 2015, the best day of the year occurred two days after its worst day.

Interestingly, the worst days in the market typically occurred in bull markets.

Why Staying Invested Benefits Investors

As historical data shows, the best days happen during market turmoil and periods of heightened market volatility. In missing the best days in the market, an investor risks losing out on meaningful return appreciation over the long run.

Not only does timing the market take considerable skill, it involves temperament, a consistent track record and more than a little luck. If there were bullet-proof signals for timing the market, they would of course be used by everyone.

I know how tempting it can be to look for a new strategy when the current one doesn’t appear to be working but, this is the very time to stay strong and look at the bigger picture, the evidence is clear, staying fully invested is the best option in the long run.  

I hope you have found this interesting but, if you have any questions about this piece or any other finance related matter, please do not hesitate to get in touch.

Yours sincerely,

Graham Ponting CFP Chartered MCSI

Managing Partner


Octoberphobia

The following is an article by Tim Cooper from this morning’s Chartered Institute for Securities and Investment (CISI) Review magazine. It is aimed at Financial Planners, but it is quite accessible and I think you will find it interesting. I have highlighted a couple of particularly important sentences.

“October … is one of the peculiarly dangerous months to speculate in stocks,” says the title character in Mark Twain’s 1894 novel Pudd’nhead Wilson. “The others are July, January, September, April, November, May, March, June, December, August and February.”

The ‘October effect’ – psychological anticipation that financial declines and stock market crashes are more likely to occur during this month than any other – has its origins in the Panic of 1907, which started in mid-October and saw the New York Stock Exchange fall almost 50%. Then in 1929, the Dow Jones Industrial Average (DJIA) fell by a combined 25% on 28 and 29 October, triggering the Great Depression, and on Black Monday on 19 October 1987, the DJIA fell by 22.6%.

“Humans have a psychological tendency to see patterns, even if they’re not statistically robust, leading to sub-optimal decisions”. And, although the first ripples of the global financial crisis began with problems in the US subprime mortgage market spreading to Europe in the summer of 2007, the crisis was officially recognised as such when G7 leaders held an emergency meeting in Washington DC on 10 October 2008.

But crashes can and do happen in any month. Black Friday 1869, which saw the collapse of the US gold market, and Black Wednesday 1992, when a collapse in the pound forced Britain to withdraw from the European Exchange Rate Mechanism, both took place in September. The dot-com bubble burst in March 2000, and, most recently, the 2020 Covid crash started in February.

However, October endured a 35% higher standard deviation (volatility) of monthly returns than the average for the other 11 months of the year, according to an August 2023 CFRA report shared with the CISI. So, what’s behind the stock market movements the month has historically experienced?

Possible causes 

The psychological bias towards predicting a negative outcome for October could cause some investors to fear a downturn during the month, leading to emotionally biased decisions. Other theories focus on the uncertainty created by buildups to bi-yearly US elections, which start in November. There is also the fact that mutual funds’ (Unit Trusts in the UK) financial years end around 31 October, so they tend to trade more as this date approaches.

Another factor could be that trade volumes are naturally quiet during the northern hemisphere’s summer holidays, then gradually build to a peak in October. Russ Mould, Chartered MCSI, investment research director at online investment platform AJ Bell, believes this trend could be exacerbated by market psychology. He points out that investors tend to start the calendar year optimistically, but if third-quarter earnings, published in October, are disappointing, reality kicks in. Traders start closing positions, boosting volatility.

Whatever the reasons, these perceptions about October could create opportunities for investors. Contrarian investors, who trade against prevailing trends to exploit herd mentality, might short stocks – a hedging strategy that profits from any negative trend – during the month. Or they could buy volatility funds, which make money based on the degree to which prices change.

This volatility could also be attributed to opportunistic investors who de-risk their portfolios as October approaches by allocating towards lower-risk assets such as cash or government bonds. Then they might watch for a slump and increase allocation towards risk assets, such as equities. This strategy is supported by analysis by the Stock Trader's Almanac, showing that more bear markets have ended in October than begun. As a reminder a bear market (shares falling) ends when a bull market (shares rising) is about to begin. The timing of these events can only be measured with hindsight of course.

In the chart below, DJIA references the Dow Jones Industrial Average which represents just 30 stocks, the S&P 500, which covers 500 stocks and the NASDAQ, which is the index of tech shares only.  

Another possible cause is that some traders may look for undervalued stocks in an autumnal slump, using fundamental analysis of share prices against financial performance. On the other hand, more pessimistic investors might simply stick to a defensive strategy and stay in lower-risk assets throughout the month.

However, any October-based strategy will rely on market timing, which many financial advisers (including me) avoid in favour of ‘time in the market’ – staying invested in risk assets such as shares – which they see as a more reliable long-term strategy.

“Traders might try to time money movements,” Russ says. “But I doubt advisers, clients or private investors will try to second-guess the October effect. Avoiding daily noise and taking a long-term view – with a target return, delineated risk appetite, and balanced, diversified portfolio – is the best plan."

Though many have biases or opinions, no one knows for sure whether the current economic environment will result in inflation, stagflation, deflation, or just steady growth over the coming months, Russ says. And no one knows which sectors or assets will be winners or losers. Diversification across asset classes, geographies, sectors and styles will help smooth out any short-term volatility.

Automatic rebalancing, say once a year, will also help overcome any inclination to predict markets, he adds. All these factors combined help the portfolio defend against a range of possible macro and market outcomes, not just one.

‘Octoberphobia’ carries dangers, as it may lead investors to buy high, sell low, or waste time out of the market, which is one of the biggest genuine risks they face long term. By educating clients about psychological biases, advisers can help clients avoid such dangers.

Greg Davies, head of behavioural science at Oxford Risk – a behavioural finance fintech serving wealth managers, robo-advisers and pension providers – says advisers need to be particularly wary of such biases, as once investors have sold out of markets, it’s harder to get them back in again.

Greg points to a plethora of perceived seasonal trends, such as the ‘January effect’ (whereby stock prices purportedly rise in the first month of the year) and the ‘sell in May and come back on St Leger’s Day’ strategy (which warns investors to ditch UK shares before the summer months, and then buy them back in September, at the start of autumn).

Greg explains. “Individual investors also react differently based on their beliefs and perceptions. Advisers need to understand their clients' unique psychological profiles and tailor communication to help reframe the message.”

For example, some clients may have high composure during market crashes. Others may need more regular guidance and reassurance with personalised messages. Segmenting clients by such psychological dimensions enables personalisation that can help clients stick to their long-term plan, he says.

US-based Brenda Morris CFP®, founder of Humane Investing, agrees and says she avoids market timing in favour of “keeping it simple and sticking to the basics”. She encourages clients to keep their investments boring and get excitement elsewhere.

“I remind them of the case for diversification every year,” she says. “Also, dollar-cost-averaging (the smoothing benefit of regular saving) is a great way to hedge the volatility that is part of investing – in October as at any other time.” Having a financial plan to reflect on helps calm nerves when volatility would otherwise cause angst, she adds.

This article serves as a reminder that we should endeavour to resist our unconscious bias and ‘instincts’ around buying and selling investments, it’s impossible to time the markets routinely and consistently over the long-term and if we have a properly diversified portfolio, we don’t need to try.  

I hope you have found this interesting but, if you have any questions about this piece or any other finance related matter, please do not hesitate to get in touch.

Yours sincerely,

Graham Ponting CFP Chartered MCSI

Managing Partner


What happened when an AI machine bought stocks?

I was delighted to read this article by David Thorpe in FT Adviser yesterday because ever since the advent of Artificial Intelligence (AI), I have been wondering whether someone might one day use to it to trade stocks? It turns out I didn’t have long to wait, see below:

“An investment process that used artificial intelligence with no human involvement outperformed during a bear market and in the early stages of a recovery, according to an experiment conducted by Ryan Pannell, who runs investment firm Kaiju Worldwide.

Pannell said that while strategies which deploy machine learning tools have long existed, usually branded as “quantitative”, he said the limitation of these strategies was that humans tended to be excessively influenced by previous data and their own experiences, and these inputs can prevent the full value of the artificial intelligence being felt, “as what happens is the human builds a set of static rules for the AI to operate within, but that tends to mean the full potential of the machine learning is not harnessed.

The other issue is that quant strategies tend to be based around back testing, i.e. looking at how they would have done in previous market conditions, and from there, a static set of rules end up being created.

He says the key value that an AI can add is the ability to recognise patterns in how stocks are being bought and sold.

Pannell said the limitation of AI was that it "can’t creatively come up with a solution to something it hasn’t seen before, but it can adjust".

When he ran an AI programme to invest in US stocks, for example, it missed the sell-off in US bank shares caused by the collapse of Silicon Valley Bank. 

He said this was because the machine could not understand the reason for the contagion impacting other bank shares, and so could not immediately understand why they were selling off, instead mis-identifying the sell-off as an opportunity to “buy the dip”.

Over the longer time period, Pannell said AI strongly outperformed in bear markets, losing around 20 per cent, when the US index dropped 35 per cent.

He believes the reason for this is that in a profound bear market, “stocks are sold off because sentiment is so negative, so even if there is no reason for a stock to fall, it will do, and that’s something an AI system can’t really understand".

"But the gains it makes will come, just as sentiment hits the bottom, and the market starts to recover, because that’s when, if a stock falls, it is easier to understand why it might be falling for the wrong reason, i.e., it might be artificial over-selling. That is really where the value is added by AI."

I thought this article was really interesting and to some extent it supports the old adage that markets are governed by ‘fear and greed’. An AI bot has no such emotions and consequently it cannot understand things such as sentiment driven selling (or buying). I always scratch my head when say, Apple has a bad day in the US and say, Tesco shares, along with most of the UK market, fall. Why are these two seemingly separate things connected and the answer is of course, they are not, it could simply be that it’s a ‘risk off’ day! The fall in Tesco’s share price in this example clearly has nothing to do with the financial prospects for the company and so how could AI know to sell Tesco when Apple has a bad day? The fact that Tesco will not always fall when Apple has a bad day further will further confuse the AI algorithm.

The result of the experiment seems to suggest however, that AI was successful, but these results can only have been achieved by ‘back testing’. This means the experiment looked at what would have happened if AI had been trading during previous Bull and Bear Markets (Bull markets occur when shares are going up and Bear markets when shares are falling). This type of analysis is notoriously unreliable because altering the time period of the test, even by just a few days, can have a profound impact on the results.

In summary, I remain to be convinced, although I wonder if AI might be a good student of form at the races? Maybe someone will try that too.

I hope you have found this interesting but, if you have any questions about this piece or any other finance related matter, please do not hesitate to get in touch.

Yours sincerely,

Graham Ponting CFP Chartered MCSI

Managing Partner


Averages can be unhelpful

Averages are everywhere. 

  • If you’re weighing up taking an umbrella, the weather report will show the average likelihood of rain in an area.

  •  Or when you’re watching football, or tennis, or cricket, the bottom of the screen is usually filled with graphics showing averages of possession, or first serves made, or runs scored.

But while averages are a useful way to simplify things, they aren’t always useful (for example, no-one in the UK has exactly 1.9 children).

And sometimes, they’re worse than useless, they’re misleading …

Famously, US Air Force Lt. Gilbert Daniels found this while trying to design a cockpit for the average US fighter pilot in the 1950’s. More than 4000 pilots had 10 key measurements taken (chest/legs/arms). And not one of the pilots matched the overall average. Some might have average arm-span, but longer or shorter legs, or a wider or thinner chest. The ‘average’ pilot simply didn’t exist!

And in finance, we see the same thing. The average year in markets doesn’t really exist.

The average return of the S&P 500 over the last 42 years is 10%. But only once in those 42 years has the actual annual return been 10% (in 2016)!

Only three other years are even within 2%; there are huge positive years, uninspiring sideways years, and terrifying negative years.

Source: Macrobond/7IM

Thus, the only way to have captured this ‘average’ return would have been to have stayed invested throughout. It’s not always possible to do this of course, there are any number of reasons why one might need to dip into one’s capital but doing so after a negative year is to be avoided……if at all possible.

It is the unpredictable nature of market returns that make proper financial planning so essential. If we build a plan based on an average investment return of say, 5% per annum, it might look great at outset but what-if the returns are delivered in the seemingly arbitrary way above? A few bad years at the beginning of the plan might mean that adjustments to spending need to be made to keep on track and similarly, if one is lucky enough to enjoy some good early years, then maybe a few extra nice holidays could be a possibility, for example. The upshot is that no financial plan can be simply, ‘fire and forget’, it must be reviewed on a regular basis.   

There is no doubt that we are currently in a period of uncertainty BUT, we have been through periods of uncertainty many, many times before and eventually we have come through to the other side. The following slide puts the current situation into perspective and, as we can see from the far right of the graph that as of December 2022, we were in negative territory, and we still are as of 31st August 2023, but this is not going to last forever

It is interesting that this chart covers a longer period than the previous one, 62 years, as opposed to 42 years and yet the average long-term return of the S&P 500 remains 10% per annum, which is surprising!

The key question this second chart begs is, ‘Do you want to keep your cash on the sidelines in order to avoid the green parts of the graph, or invest in a globally diversified portfolio (fully accepting that Bear Markets are going to come along from time to time), to make sure you don’t miss the blue parts of the graph? The positive periods massively outweigh the negative in both size and duration and staying invested throughout the green and the blue, is the surest way a private investor has to create wealth.  

In pondering the chart above, consider the following. These are headlines from 3 different news sources I found on my iPhone this morning concerning the US stock market:

Morgan Stanley analyst predicts S&P 500 could leap another 11% this year, boosted by gains in ‘Magnificent Seven’ stocks!

After calling the S&P 500’s climb this year, this strategist says hang on, the gains aren’t over.

Stock Market Crash: S&P 500 will drop 30% or more experts warn!

The divergence of opinion here just goes to prove that NO-ONE knows what’s coming next but as a long-term investor, the chart above proves that it doesn’t matter, you should invest anyway.

Pessimists might look smart from time to time but it’s the optimists who make money!

I hope you have found this interesting but, if you have any questions about this piece or any other finance related matter, please do not hesitate to get in touch.

Yours sincerely,


Graham Ponting CFP Chartered MCSI

Managing Partner

The long tail of inflation

Inflation figures have been released this morning, showing that inflation has again fallen sharply to 6.80%, as expected. This is potentially good news for mortgage holders, as it may mean an early end to interest rate hikes that we have seen over the past few months.

On the subject of inflation, I am indebted to my friends at 7IM for the following data.  

If you’ve renewed your car insurance recently, you’re probably still in shock.

The Association of British Insurers found that the average price of car insurance has risen by 21% compared to this time a year ago, now coming in at more than £500 per year*. And sadly, their data isn’t on quoted prices, but on actual paid prices – i.e. after you’ve spent an hour on the phone, threatened to leave, been put through to a different department etc …

So what’s going on?

Well, the car insurance industry is basically still suffering with COVID.

Last year, insurers paid out £1.10 in damages for every £1 of premium they received. They made a loss on their car insurance business.

The cost of repairs was so much higher than expected, due to the increased costs of spare car parts and replacement vehicles – as the chart below shows.

UK Consumer Price Index Sub-categories

Source: 7IM/ONS. Rebased to 01/01/2019.

There have also been other cost pressures which aren’t captured in the chart – such as the cost of labour, due to car mechanics retiring or retraining during COVID, or courtesy car hire being more expensive.

It’s a great illustration of why inflation is so difficult to get under control, and for central banks to predict. So many moving parts (literally so in this case), and with such long lags before the impact is felt:

  • The world locked down over three years ago …

  • So, supply chains were struggling two years ago …

  • So, used car prices shot up 18 months ago …

  • So, car insurance companies made losses over the last 12 months …

  • And so, your insurance premium is rising this year.

Economic textbooks always make things sound so straightforward; the reality of why prices go up (or down) is always far more complicated.

* https://www.abi.org.uk/news/news-articles/2023/8/sustained-cost-pressures-on-insurers-push-the-average-price-of-motor-insurance-to-a-record-high/

 As you know, I do like to try and end these missives on a positive note. The following short video (4 mins) provides such a tone. The speaker is Steven Bell, Chief Economist at Columbia Threadneedle. To watch the video, after you have followed the link, you will need to agree to proceed as an intermediary. This is a compliance issue to protect Columbia Threadneedle, however, I have viewed the video carefully and there is nothing in it which is likely to lead to any client making a poor decision.

https://www.columbiathreadneedle.co.uk/en/intm/umap-posts/uk-inflation-to-fall-and-labour-market-to-weaken-good-news-for-interest-rates/

I hope you have found this interesting but, if you have any questions about this piece or any other finance related matter, please do not hesitate to get in touch.

Yours sincerely,


Graham Ponting CFP Chartered MCSI

Managing Partner

How valuable is a full State Pension?

There can be lots of reasons why you might not get the maximum State Pension.

If you’ve taken time out of work to raise children or care for elderly parents, if your earnings have been very low or you’ve worked for yourself, or if you’ve spent time living and working abroad - all can be reasons why you may not qualify for the full amount.

If that’s the case, it could cost you dearly in retirement. That’s because the State Pension is extremely valuable income - and very expensive to replace.

How expensive? According to the latest market prices, replacing the current maximum State Pension (available to those retiring after 5 April 2016) would cost slightly more than £205,430. That’s based on buying an annuity to replace the income provided by the State Pension.

The reason it costs so much to replace is obvious - the State Pension is both guaranteed and protected against inflation, two things that are precious and difficult to replicate any other way.

The current rate on an annuity paid to a healthy 65-year-old is around 5.16%. That’s with income payments escalating by 3% a year to combat rises in prices – not the full protection against inflation that the State Pension enjoys thanks to the ‘triple lock’ (the promise to raise the payment by the greater of inflation, wage rises or 2.5%), but still very valuable.

On the basis of that rate, it would require £205,430 of pension savings to replace the current full State Pension of £203.85 a week.

As you are almost certainly aware, annuities are not the only way to get an income from retirement savings. Income drawdown is another option. A rule of thumb used by many is that someone can withdraw around 4% a year from their drawdown pot and still have a good chance that their savings will last for 30 years. I won’t go into this here but the ‘4% Rule’ is much misunderstood and in many cases much higher withdrawals can be sustained.

However, if we go with the ‘4% Rule’, just for illustrative purposes, an individual would need £265,005 of pension savings in drawdown to recreate the State Pension income - more than an annuity and without the guarantee that income will last until you die, BUT with the benefit that the money remains available to you, whilst you are still alive, or your family when you die.

Why the State Pension is so valuable

Given the high cost of getting it any other way, it makes sense for most clients to maximise the income they get from the State Pension. Your entitlement to the State Pension is, of course, based on your National Insurance (NI) contributions. To get the full State Pension you need to have made NI contributions for 35 complete years by the time you retire.

An additional calculation suggests that one would have needed to have paid approx. £160.00 per month, increasing by 2.50% per year and with investment growth of 4.0% per year, to arrive at a figure of £205,430 after a period of 35 years. It might be interesting to work out whether that means the NI contributions we have paid in over the years have represented good value …..or not?   

The government has an online service that lets you check your NI record for any gaps and to see whether you’ll get the full amount. You’ll need a government Gateway account, which you can sign-up for using details from your passport, payslips or P60. If you have gaps in your record, you may be able to pay voluntary NI contributions to fill them, or else fill them with NI credits that apply in some circumstances.

I hope you have found this interesting but, if you have any questions about this piece or any other finance related matter, please do not hesitate to get in touch.

Yours sincerely,

Graham Ponting CFP Chartered MCSI

Managing Partner


Student Finance – Should you repay your child’s loan(s)?

This is a question I am often asked and my usual response is to direct clients to Martin Lewis’s excellent work on this subject at the following link: https://www.moneysavingexpert.com/students/repay-post-2012-student-loan/

However, the following appeared in Times a couple of weeks or so ago and I thought it provided quite a helpful summary of the position.  

You asked

“I want to give my daughter £50,000 towards her future. She recently graduated with the same amount of debt on her student loan and is now working. Should I pay off the loan or hand her the money to invest instead?“

Our response

There are now over half a million student loan borrowers in England who owe more than £50,000 each, according to the latest government statistics.

These are largely people who started university after September 2012, when the government allowed university tuition fees to rise to up to £9,000 a year. They are on “plan two” student loans.

But this is an interesting debate because, while they are defined as “loans” on paper, the repayments don’t carry the same rules as typical borrowing.

First, there is no “interest-free” period as such – the interest starts to accrue from the first day of term – but the repayments on plan two loans do not begin until the April after the course finishes, and even then, only once the graduate is earning more than £27,295 a year.

People who took out a plan two loan have to repay 9% of any income they earn above this threshold. The interest is charged at the retail price index (RPI) measure of inflation plus up to 3% (depending on how much the borrowers go on to earn) each year. Earn below £27,295 and they won’t have to pay a penny back.

Thirty years after graduation, the loan is written off by the government.

This arrangement benefits lower earners, but remember that with this type of loan, how much you have to repay is linked to your earnings, not how much you owe. So, if you start your career on a high salary that continues to grow, you are likely to pay tens of thousands of pounds in interest. 

So, could you save on this by paying the loan off early?

The maths


Your daughter has £50,000 in debt. You haven’t specified her salary, so let’s take a look at a few different scenarios.

If someone starts their career on £25,000 which rises by 2% a year for 30 years, they will never clear it on their own. By the 30th year, they would have repaid £18,560 and still owe £134,000. In this scenario, it would not make sense for them to pay off the loan upfront.

A graduate starting on £35,000 a year and receiving the same rate of salary increase, would repay £29,388 over 30-years. By the time the debt was wiped, they would still owe £131,579.

A high-flyer who landed a £45,000 starting salary would, in our scenario, pay £67,530 over 30 years. In this case, it could make sense to clear the loan early, as the amount they pay over 30 years would exceed the loan they took out.

Money analyst Laura Suter at investment platform AJ Bell explains: “A starting salary of £40,000, which gradually increases over the next 30 years, is the tipping point where you’ll end up repaying the same amount that you borrowed.”

But even in this scenario, there is a huge gamble involved. If your daughter were to later take a pay cut, reduce her hours or have a career break, you could find yourself in a situation where you paid off a loan that would have been wiped anyway.

How much you repay with £50,000 of student loan debt
[Source: AJ Bell.Based on Plan 2 loan, with initial debt of £50,000, 2% a year salary increases and a starting threshold of £27,295 that increases by 2% each year plus RPI and 9% repayments] These figures are based on plan two loans.

So, should I pay off my daughter’s loan?

Generally, if your daughter is a high earner, who started her career on a salary of £40,000 that you’re confident will continue to rise, they may be better off paying off the loan as soon as they can. By doing so they can avoid some interest payments.

This is because they would always be incurring the highest level of interest – RPI plus 3% – and so their loan would continue to grow with the interest outpacing repayments.

By clearing the loan early, you may also boost her chances of hitting other milestones such as home ownership. Student loans do not affect your ability to borrow money, but lenders do take it into consideration when calculating affordability. As the loan reduces take-home pay, it could potentially affect your daughter’s ability to borrow. 

At the other end of the spectrum, if your daughter has an average income, you could consider investing the money instead, as she may never pay off her initial debt and eventually the loan will just be wiped off.

Of course, this is not taking into account potential policy changes. The government has already raised the 30-year rule to 40 for new students from September this year. In the future, more changes could follow, so this is worth bearing in mind.

Suter adds: “It is nigh-on impossible to work out whether you’re better off repaying your loan immediately after university, or holding onto that money and using it for something else.

“It all depends on your starting salary, how much of a pay rise you see over your career, whether you take any career breaks, or whether you work part-time at any point. It also depends on what future governments do with the interest rate you pay on the debt and the threshold for repayments.”

What could I do with the money instead?

One option could be to invest the money. On an average return of 5% a year, that £50,000 would have grown to almost £63,814 after five years. After 10 years it would be worth almost £81,445, thanks to compound interest.

That same money based on a 7% annual return would be worth £70,128 over five years. Over 10, it would be worth £98,358 according to calculations by investment platform Interactive Investor.

Those are significant amounts that could help your daughter to, say, buy a property or prepare for retirement. If you choose this option, speak to a professional financial adviser. While investments tend to be the best way of growing your money, they can go down as well as up.

If property is her primary goal, you could alternatively drip-feed the £50,000 into a lifetime ISA in your daughter’s name. You pay in up to £4,000 a year and benefit from a £1,000 government bonus on top.  It would take you just over 12 years to put the whole £50,000 into a lifetime ISA, but at the end of that period, it would be worth a bit more than £83,500, assuming returns of 5% a year.

You may also want to make sure you have a financial safety net in place before investing any money.

Myron Jobson at investment platform Interactive Investor explains: “Regardless of which side of the argument you choose, it is important to ensure that your finances are in good nick before considering putting in more than the minimum toward repaying a student loan.

“This means paying off any outstanding high-interest debts and maintaining a healthy rainy-day fund of three to six months’ worth of salary or more, if you can afford it – and ensuring that other payment obligations are accounted for.”

Summary

As is so often the case with financial planning matters, the answer to what seems like a fairly simple question is….it depends. It will only be from some future vantage point that you will be able to look back and say whether the decision you made was the right one or not. Putting a positive spin on this, as there is no clear-cut answer, you are not likely to have made a terrible mistake, one way or the other.   

I hope you have found this interesting but, if you have any questions about this piece or any other finance related matter, please do not hesitate to get in touch.

Yours sincerely,

Graham Ponting CFP Chartered MCSI

Managing Partner


The impact of exchange rates on geographically diversified portfolios

As you know, our portfolios are heavily weighted towards the US and I have often said that a decent indicator of direction of travel of our portfolios would probably be the S&P 500, as opposed to say, the FTSE 100, for that reason. The equity content of the ebi portfolios is currently spread as follows, with smaller amounts allocated to many other countries (not Russia, I hasten to add).

However, a number of clients have observed that their portfolios do not currently seem to be following the S&P 500 in any reliable way, and I do agree. There is a reason for this, and I hope what follows will shed some light on the genuinely extraordinary circumstances that have led to this situation.

In brief summary, it is to do with the Sterling/US Dollar exchange rate. Assets held in the US will have a higher value in the UK when Sterling is weak (the dollar value buys more pounds) and of course vice versa. As Sterling strengthens, the dollar value of US held assets declines. In normal circumstances these fluctuations are generally small and are accepted as part of owning an internationally diversified portfolio. However, the following chart shows the unusually volatile situation with the exchange rate over the past 2 years.

According to the interactive version of this chart, which can be found at https://www.xe.com/currencycharts/?from=GBP&to=USD&view=2Y, the Sterling/US Dollar exchange rate on 1st Jan 2022 was $1.35289 but by 27th September, this had fallen to $1.07687, a drop of 20.40%. Part of the reason for the extreme dip in September was of course, Kwasi Kwarteng’s disastrous mini-Budget which significantly undermined confidence in the UK but, the general decline in Sterling had already begun long before this, as the US Federal Reserve began increasing interest rates in response to rising inflation in the States, making the Dollar relatively more attractive to investors than Sterling.

There was however, some good news in Sterling’s weakness for clients last year, not that it necessarily felt like it. This was because when the S&P 500 fell by 18.51% between 1st Jan 2022 and 31st December 2022, UK investors only suffered a drop in value of their US investments of 8.25%. See charts below:

S&P 500 in US Dollar terms

S&P 500 in Sterling terms

Thus, our clients were shielded from a significant part of the turmoil in the US by weakening Sterling. It didn’t feel like much of a victory because, let’s face it, an 8.25% fall is still a significant loss. Nevertheless, our portfolios not mirroring the S&P 500 last year was a good thing.  

As inflation in the US has been falling (it is down at somewhere around 3.0% now), the currency markets are now betting on US interest rates being cut in the relatively near future. In the UK however, we are expecting the numbers to show tomorrow that inflation has remained stubbornly high. If that is indeed the case, then it is likely that interest rates in the UK will go higher and remain high for longer – this is good news for Sterling and we can see that the US Dollar exchange rate has now recovered by 21.47% to $1.30803, as of yesterday. The problem with this increase in the value of Sterling is that it has diluted the recovery we have seen in the S&P 500 since the start of the year. The following charts show the S&P 500 in Dollar and Sterling terms since the start of the year:

S&P 500 in US Dollar terms – 1st Jan 2023 to 17th July 2023

S&P 500 in Sterling terms – 1st Jan 2023 to 17th July 2023

These charts show that the S&P 500 has grown by 18.87% since the beginning of the year in Dollar terms but in Sterling terms, only by 9.30%. Thus, UK investors have benefited from just 50.71% of the rise in the US since Jan.

An added complication in all of this has been the impact on Bond Markets of sharply rising interest rates. The capital value of a Fixed Income investment (Bonds and Gilts etc.) will fall as interest rates rise, because the fixed income attaching to the Bond becomes relatively less attractive. The portfolios of the majority of our clients have been affected by this, depending on the level of Bond exposure. The following chart compares the ebi Global Bond exposure to just UK Bonds in the form of Gilts from 31st December 2021 to 17th July 2023:

Many investment managers with a UK bias have suffered particularly badly during the course of the last 18 months because of the above. High risk clients expect extreme volatility from time to time but medium risk investors less so.

An additional issue a couple of clients have raised with me is whether they might be better investing in the UK say, in the FTSE 100. However, an earlier blog I issued in March details why most funds now eschew the UK in favour of the US. The performance of the UK was good last year, because of the energy crisis (the FTSE is largely made up of oil, gas and miners) but looking forward, this is not likely to be sustainable. The following chart shows the S&P 500 vs FTSE 100 over the last 20 years in Sterling terms:

With almost all major tech companies listed in the US and with the advent of AI, our view is that this gap in performance is likely to persist, hence our weighting to the US.

The final point I would like to make is that although performance has been disappointing for all of us over the past 18 months or so, ebi have still outperformed the sector averages, confirming that all fund managers are finding these market conditions challenging. The only thing we can do is have faith that all of the headwinds we are facing will eventually pass…….as they always have in the past.

This next chart shows the performance of portfolio Vantage Earth 60 (our most popular portfolio) over the past 18 months against the appropriate sector average (the sector contains 575 funds):

As I am keen to finish on a positive note, this final chart shows Vantage Earth 60 (simulated returns), against the sector average over the past 10 years.

I hope you have found this interesting but, if you have any questions about this piece or any other finance related matter, please do not hesitate to get in touch.

Yours sincerely,

Graham Ponting CFP Chartered MCSI

Managing Partner


A Question of Perspective

Big numbers are hard to put in perspective. We hear millions, billions and trillions thrown around a lot in finance, but it requires a real effort to think about how much that actually is.

A useful way of gaining perspective is to turn it into time periods (helpfully calculated by NASA, so you know it’s accurate*).

If you went back in time for one million seconds, it would be Friday, 23rd June. 12 days.

If you went back in time for one billion seconds, it would be Sunday, 27th October, 1991. Nearly 32 YEARS.

But the really mind blowing one is this…

If you went back in time for one trillion seconds, you’d be 32,000 years in the past. Days of the week would be irrelevant, you’d be more worried about the fact that ice sheets covered most of the UK, and your closest friend was this guy:

Source: National Geographic

So, when we hear that the UK currently has a national debt of around £2.5 trillion**, we can acknowledge that is a LOT of debt.

But we shouldn’t panic too much.

Because when you put what the UK has borrowed up against what the UK is worth, things look a little better.

And that’s what the debt/GDP ratio below does (all the way back to the reign of King James II). 

UK National Debt as % of GDP

Source: Deutsche Bank/GFD 

In 1815, after the Napoleonic wars, UK debt was £854 million – 1/3000th of today’s level. But that represented nearly 250% of GDP!

Today the debt/GDP ratio is 100%. Similar to most other developed nations, and not exceptional vs history.  

Perspective is everything!

I hope you have found this interesting but, if you have any questions about this piece or any other finance related matter, please do not hesitate to get in touch.
Yours sincerely,

Graham Ponting CFP Chartered MCSI

Managing Partner


Mortgages – UK vs US

Due to a shared history and a common language, the UK and the US have a lot of cultural similarities.

If something (a film, a book, music, a play, a brand) is popular in the UK, it’s got a good chance of being popular in the US, and vice versa. You give us Friends and Hamilton, we’ll trade you for Downton Abbey and James Corden (he went to school not 800 yards from where I am typing).

But in one important area, the US and the UK parted ways nearly one hundred years ago.

Mortgages

In the Roaring 1920’s, the US mortgage market looked quite like the UK. 2-year and 3-year fixed term mortgages were normal.

Then the Great Depression hit. Hundreds of thousands of people lost their homes. Millions more found themselves underwater.

The US government stepped in. And to avoid repeating history, it basically said “mortgages should be fixed for as long as possible”. The 30-year mortgage was born. Today, more than 70% of American homeowners have 30-year fixed mortgages.

In the UK that didn’t happen.

Your choice here is between a variable rate, or a short-term fix. Anything more than five years is very rare.

Which leads to the huge difference in the chart below:

Source: Bank of England/Mortgage Bankers Association/7IM

In the short-term, this means that changes in interest rates hit mortgage-owning households far more quickly in the UK than in the US.

Whereas in America, if rates go up, you don’t have to do anything – you’ve capped your costs for 30 years. If they go down, you re-mortgage and lock in a lower rate … for thirty years! It really is win-win.

And, having had nearly 100 years of these type of mortgages, consumer behaviour has changed between the two countries. Imagine knowing your mortgage costs were capped for three decades – if you had established your budget and knew what you were paying, wouldn’t you feel more relaxed?!

If our next import from the US was a range of 30-year mortgage deals (rather than another Marvel superhero film), I wonder how quickly the above chart would change?

The above does beg the question though, why have increased interest rates in the US been so effective in bringing down inflation, if mortgage borrowers are seemingly unaffected, when in the UK higher interest rates seem to be having little effect? Answers on a postcard please!

I hope you have found this interesting but, if you have any questions about this piece or any other finance related matter, please do not hesitate to get in touch.

Yours sincerely,

Graham Ponting CFP Chartered MCSI

Managing Partner