
Firstly, a very Happy New Year! I hope you enjoyed the Festive Period in the company of loved ones and great friends.
The following is an article I read this morning by Craig L. Israelsen, Ph.D., a Financial Planning contributing writer in Springville, Utah, he is an executive in residence in the personal financial planning program at the Woodbury School of Business at Utah Valley University.
The article is aimed at US Financial Planners but during this uncertain period, I thought you might find the central message reassuring and interesting. I have highlighted the most interesting statistics, just in case you don’t have time to read the entire piece.
“Ask your client this question: "What was the last movie you watched?"
They probably didn’t have to think too hard to remember. Then try this one: "How about a movie you watched in 1985?"
No dice — right?
Clients recall the performance of their investments similarly; that is, they remember recent performance with greater clarity. This trait, called recency bias, leads them to extrapolate into the future the good or bad they are experiencing in the moment. That skews their expectations — for better or worse — and distorts their view.
But there’s one notable exception to recency bias: the period in which your client’s portfolio suffered a significant loss. Referred to as loss aversion, this sentiment is also quite real. Investors simply don’t like big losses. Case in point: Have your clients forgotten about 2008?
So a recent loss in portfolio value can trigger both recency bias and loss aversion, and that can lead to “sell everything” phone calls. In the worst case, this type of fear cycle can wreak havoc if long-term plans are abandoned abruptly.
A recent loss in portfolio value can trigger "sell everything” phone calls.
In the chart called “Big Picture” we see a summary of the annual returns of seven core asset classes (indexes) over the past 49 years — as well as two portfolios. The first portfolio included all seven indexes in equal allocations; the second was a 60/40 portfolio consisting of 60% U.S. large stock and 40% U.S. bonds. Both portfolios were rebalanced annually over the 49-year period of analysis from 1970 to 2018. The calendar year losses of each individual index and both portfolios are shaded in pink. It’s these pink boxes that test the resolve of investors. But, as can be seen, the losses are relatively infrequent.
For example, over the 49 years from 1970-2018, large cap U.S. stock has produced positive nominal calendar year returns 80% of the time and generated an average annualized return of 10.21%. If we consider the impact of inflation, large cap U.S. stock had positive real returns 71% of the time and an after-inflation (or real) average annualized return of 6.00%.
By comparison, U.S. cash (as measured by the 90-day Treasury bill) had a 49-year average annualized return of 4.80% and positive nominal annual returns 100% of the time. But, after factoring out the impact of inflation (as measured by the CPI) the average real return was 0.80% and real annual returns that were positive only 57% of the time.
More importantly, let’s consider the performance of the two portfolios. First, the seven-asset portfolio had positive nominal returns 86% of the time and a 49-year average annualized return of 9.48%. After inflation is factored out, the average annualized real return has been 5.30% with positive real returns 73% of the time. The 60/40 portfolio had positive nominal calendar year returns 80% of the time and a 49-year return that was 5 bps lower at 9.43%. After inflation, the 60/40 portfolio had positive returns 71% of the time and a real return of 5.25%. This information puts performance over nearly five decades into perspective.
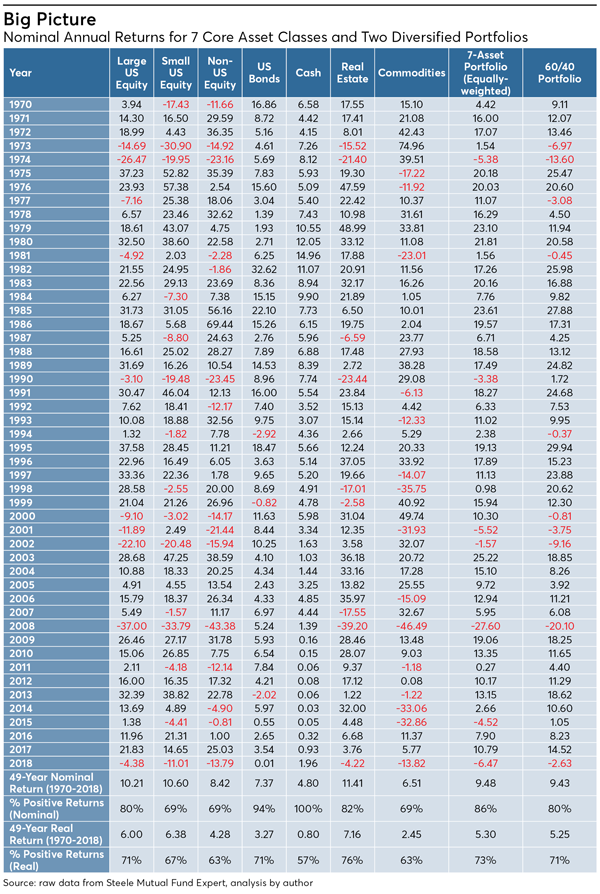
The 49-year historical performance of large-cap U.S. equities was represented by the S&P 500 Index, while the performance of small-cap U.S. equities was captured by using the Ibbotson Small Companies Index from 1970-1978 and the Russell 2000 Index from 1979-2018. The performance of non-U.S. equities was represented by the Morgan Stanley Capital International EAFE Index (Europe, Australasia, Far East) Index. U.S. bonds were represented by the Ibbotson Intermediate Term Bond Index from 1970-75 and the Barclays Capital Aggregate Bond Index from 1976-2018. As of late 2008, Lehman Brothers indexes were renamed Barclays Capital indexes.
The historical performance of cash was represented by three-month Treasury bills. The performance of real estate was measured by using the annual returns of the NAREIT Index from 1972-1977 (annual returns for 1970 and 1971 were based on research in the book “Real Estate Investment Trusts: Structure, Performance, and Investment Opportunities,” Table 2.2). From 1978-2018 the annual returns of the Dow Jones U.S. Select REIT Index were used (prior to April 2009 it was the Dow Jones Wilshire REIT Index). Finally, the historical performance of commodities was measured by the Goldman Sachs Commodities Index. As of Feb. 6, 2007, the GSCI became known as the S&P GSCI.
There is a key observation that should not be obscured by so much data: Each index (i.e., asset class) that we are evaluating had positive calendar year returns more than 68% of the time (based on nominal returns) and at least 57% of the time if using “real” inflation-adjusted returns. More importantly, the two portfolios we are evaluating had positive calendar year real returns at least 71% of the time.
Having a clear understanding of long-term asset class performance (as demonstrated in “Big Picture”) can minimize the potentially negative impact of recency bias during and after periods of market volatility — particularly when the volatility results in portfolio losses. The reality is that a broadly diversified portfolio will generate positive nominal returns nearly 90% of the time over time measured in decades, not months. Of course, a person who only invests in a diversified portfolio for two years should not expect positive returns in 90% of the 24 months. Even a diversified portfolio can experience two consecutive negative calendar year returns, such as in 2001 and 2002.
In summary, the impressive performances of the asset classes and portfolios in this study are over a 49-year period. Said differently, long-term results take a long time to replicate. The key to achieving long-term results is to stay in the saddle for a long time. The challenge is our natural instinct to avoid losses (loss aversion) and our tendency to over-emphasize what we have experienced most recently (recency bias). (For more discussion about portfolio losses see “You Can’t Win if You’re Afraid to Lose” in the October 2018 issue of Financial Planning).
The solution to countering recency bias is accurate information and proper perspective. This article has provided you with nearly five decades of information. With that information, work to help clients develop a proper perspective about the impressive performance demonstrated by a diversified investment portfolio over the past 49 years.”
Although this study concentrates on US data, results for diversified portfolios with UK equity bias, are similar.
As always, if you have any questions about the contents of this e-mail or any aspect of your financial planning, please do not hesitate to get in touch.
Yours sincerely

Graham Ponting CFP Chartered MCSI
Managing Partner
