
This communication is a follow up from a couple of earlier circular e-mails which looked at market timing and managing investor behaviour.
As I hope most of you have noticed, when markets are seemingly in freefall, I like to send out more circulars than usual, reminding everyone not to panic because market gyrations, even quite violent ones, are part and parcel of long-term investing, we just need to be patient and let them pass, which they surely will in time. I also regularly revisit the issue of ‘market timing’; buying at the bottom and selling at the top sounds ridiculously easy, particularly when we are looking at a chart of recent market movements (20:20 hindsight and all that), but in practice, as many decades of evidence proves, it’s almost impossible to pull off, regularly and consistently, such that you have a better experience than other investors.
If markets always recover (eventually), it follows that there must be some good news from time to time. I am going to use a few charts below to emphasis this point.
This first chart looks at the performance of 3 of the ebi portfolios since 31st December 2021 up until 27th October 2023, which is around the time I was last reminding everyone not to panic.

As we can see, it turns out that December 2021 was the last high point for markets, almost 2 years ago. We know why of course, markets have fallen subsequently due to roaring inflation leading to aggressive interest rate rises, the invasion of Ukraine and the subsequent energy crisis etc.
An interesting feature of this chart is how, the highest risk portfolio (Earth Equity), the lowest risk portfolio (Earth Bond) and the most popular portfolio (Earth 60), had reached virtually the same place by 27th October, even though under normal market conditions they are supposed to behave very differently. Again, we know why; higher interest rates mean less money in peoples’ pockets, which is bad news for companies and their borrowing costs also increase leaving less money for investment – the result under these conditions is that shares fall. Higher interest rates are also bad news for bonds because the fixed income they provide becomes less attractive – the result is that bonds fall in value at the same time as shares. The proverbial perfect storm.
BUT, what has happened since 27th October? Let’s take a look.
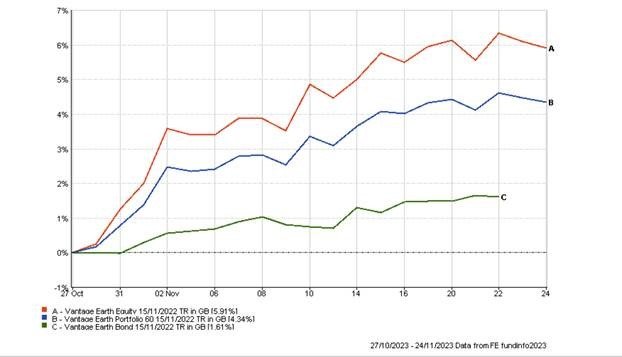
The prospect that interest rates may have peaked in the face of falling inflation and may soon even start to come down has given the markets a significant boost, the Earth Equity portfolio is up close to 6% in less than a month, even though interest rates have not actually moved an inch…yet! This recovery of sorts adds weight to my earlier e-mail where I talked about how missing the best days that come along in a year can have a serious impact on overall performance. On the subject of market timing, who honestly would have disinvested on 31st December 2021 to miss the down swing and then have reinvested on 27th October to fully capture the upswing? Missing the precise date to come out and the precise date to go back in would have made a huge difference and the chances of anyone getting it right in the absence of blind luck, are probably about the same as winning the lottery.
It is important to point out, if you didn’t already know, that this recovery through November has not taken us back to where we were on 31st December 2021, so let’s take a look at a couple of longer-term charts to put this all into perspective.
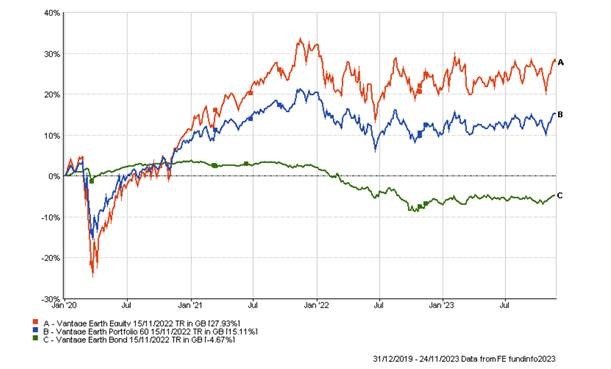
In this chart, which begins on 31st December 2019, we can clearly see the sharp decline caused by COVID and the equally sharp rise as we recovered from it. As is typical of markets, the decline was probably overdone, as was the recovery; if we were to draw a straight line from the bottom of the COVID inspired trough to where we are now, a recovery of that shape would probably have made more sense, given the recent economic backdrop.
This final chart looks at how 2 major fund managers (7IM and St James’ Place) have fared over the same period, against the similarly weighted ebi Vantage Earth Portfolio 70.

The purpose of this last chart is just to demonstrate that market conditions have been difficult for all fund managers, although it does look as though SJP have had a good run this year.
I hope you have found this interesting but, if you have any questions about this piece or any other finance related matter, please do not hesitate to get in touch.
Yours sincerely,

Graham Ponting CFP Chartered MCSI
Managing Partner
